Dashboard
There are a series of reports that are accessible from the dashboard in Fusion, that relate to specific areas.
1. Log into Clearmatch Fusion with the appropriate credentials:
2. Navigate to Dashboards > Reports:
NOTE: if the Dashboards menu option is not showing, please try clearing the cache on the browser or try using a different browser.
2. Select the name of the Finance Company from the drop down list and select the Apply button:
3. This will list all of the Dashboard Reports that are accessible under that finance company:

4. Outlined below are the list of all reports and what information that they will provide:
DASHBOARDS |
Dashboard Application
Dashboard showing the metrics relating to applications for the day, week or month.
Report shows data via Pie or Bar Graphs.

Dashboard Arrears
Dashboard showing the finance agreements in Arrears by Age Band.
Shows the movement in the last 30 days for each Age Band.
Shows the split of arrears by Credit Rating.
Written off finance agreements are shown in a separate graph.

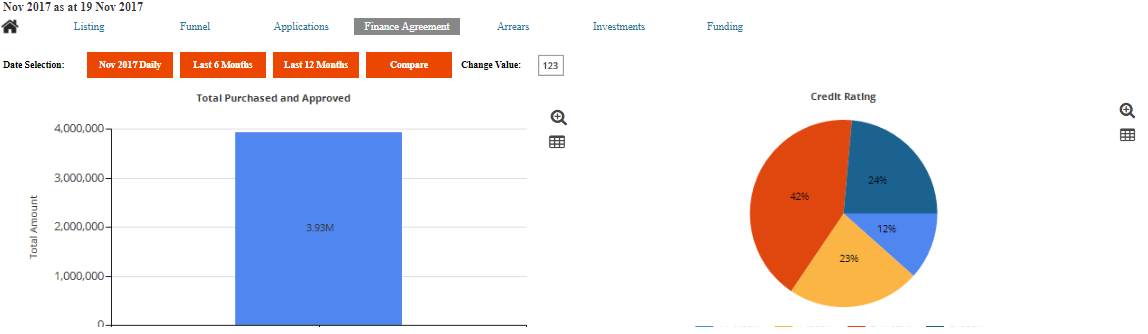
Dashboard Finance Agreement
Dashboard showing total purchased and approved finance agreements, and other metrics relating to this data.
The data can be shown by month or as a range of months (6 or 12 month option).
When showing a range of months the graphs change from pie and and bars graph, to Line and Stacked Bar graphs to show the trends better.
There is an option to compare the total purchased in the last 12 months on the same day in each month as the current day.
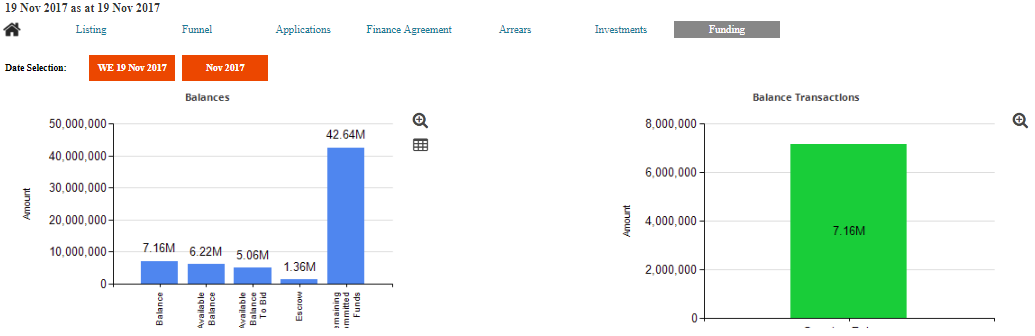
Dashboard Funding
Dashboard showing the Investors Balances and the movement for the day, week or month.
Dashboard Funnel
Dashboard shows the different status and path applications take to get to their current status.
For each status there is a current total and a funnel total for applications that have been at that status.
Selecting a status will filter the funnel statuses to only those used by the applications that have had the selected status.
The statuses are sorted in the order statuses are expected to occur, therefore the largest status will be first and the last status the smallest, this is where the report gets the name funnel from.

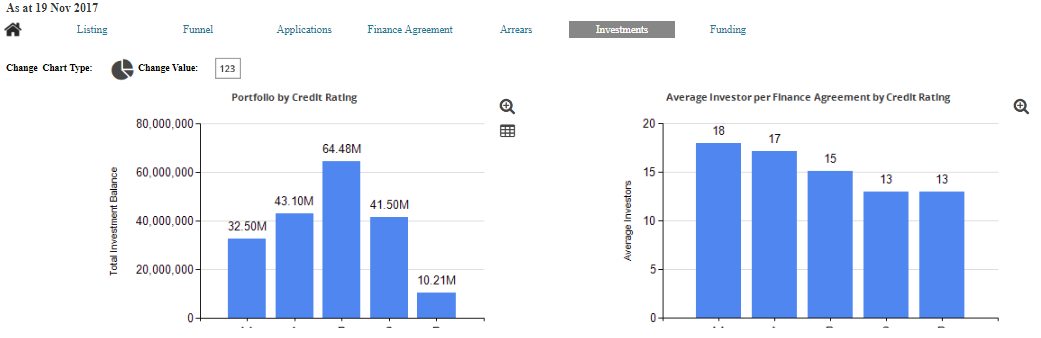
Dashboard Investment
Dashboard shows the total investment portfolio and averages for related metrics.
The portfolio metrics can be shown on Bar or Pie graphs.
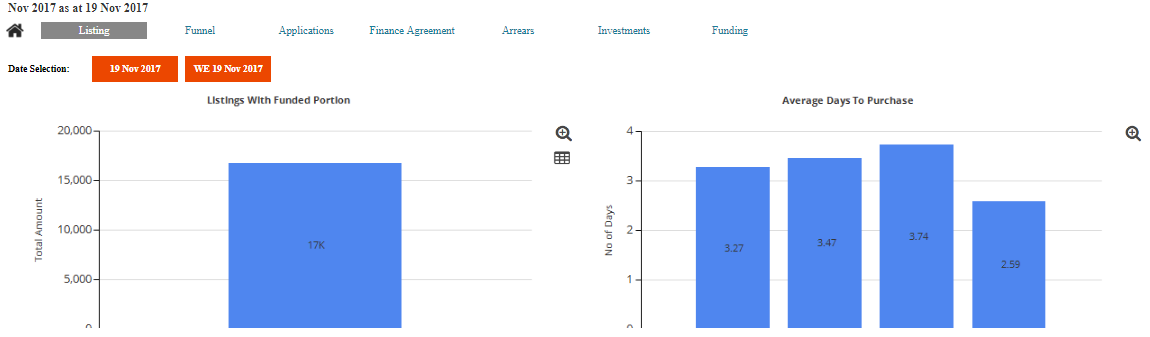
Dashboard Listing
Dashboard shows the amount of funding for approved and finalised listings.
Shows the average days to purchase by credit rating.
Shows the listings that are awaiting confirmation.
PAGINATED REPORTS |
Report Application Details
Shows the details for one application.
Details include:
- Application values and rates
- Application and Listings status history
- Decision and Credit Bureau data
- Credit Rating
- Documents uploaded
Report Application Status History
Shows a list of Applications for the day, week or month. Grouped by day when multiple days selected.
Data for the application and customer and the full status history showing the date and time each status occurred.

Report Application Summary
Drill through report from Dashboard Application.
Shows a summary based on the metric selected from the Dashboard Application for Applications by day, week or month.
Drill down by each metric to get the high level detail of each application.
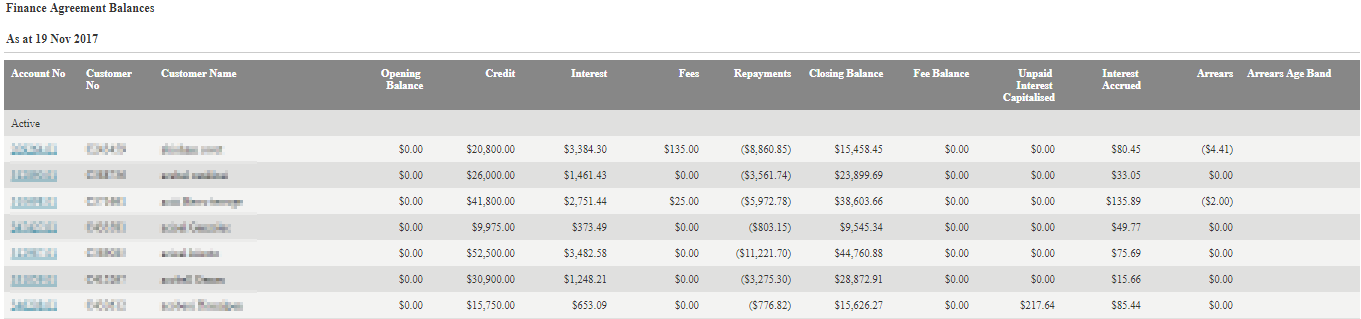
Report Finance Agreement Balances
Accounting report showing the opening balance and movements for the current month.
Includes balances for Fees, Arrears and Interest.
Report Finance Agreement Details
Shows the details for one finance agreement.
Instalments are shown are the expected repayments. The next instalment is highlighted in yellow.
Transactions are listed to show what has actually occurred.
Both sets of data are summarised by year, month, day to show a quick summary.
Details can be viewed by expanding each level.
Report Finance Agreement Repayment Breakdown
Accounting report that shows a summary of the finance agreement transactions for the month.
Balances are summarised by day and show the payment amount and the split between principle and interest.
Drill down on each day will show the balances by finance agreement.
Report Finance Agreement Summary
Drill through report from Dashboard Finance Agreement.
Shows a summary based on the metric selected from the Dashboard Finance Agreement.
If a month range has been selected, then the summary will be shown for each month.
Drill down by each metric within each month to get to the high level detail of each finance agreement.
Report Fund Account Balances
Accounting report that shows the summary balance of the Investor Fund Accounts.
Each account has an opening balance and movement for the current month.

Report Funding Summary
Drill through report from Dashboard Funding.
Shows a summary of the balances shown on the dashboard by day, week or month.
Drill through each of the balances to show the details of the investors.
Report Investment Balances
Accounting report showing the investors opening balance and movements for the current month.
Drill through to a summary by investment status.
Drill to the next level to break down the balances and movement by Investments.

Report Investment Details
Shows the details for one investment.
Instalments are shown are the expected repayments. The next instalment is highlighted in yellow.
Transactions are listed to show what has actually occurred.
Both sets of data are summarised by year, month, day to show a quick summary.
Details can be viewed by expanding each level.
Report Investment Repayment Breakdown
Accounting report that shows a summary of the investment transactions for the month.
Balances are summarised by day and show the payment amount and the split between principle and interest.
Drill down on each day will show the balances by finance agreement, the finance agreement can be expanded to show all investments.
Report Investment Summary
Drill through report from Dashboard Investment.
Shows a summary based on the metric selected from the Dashboard Investment.
Drill down by each metric to show the summary by month for the selected metric.
Drill down by month to show the Finance Agreements that have been invested in for the selected month.
The finance agreement can be expanded to show all investments, investors and investment interest rate.
Report Investment Weighted Balance Detail
Show for each investment the transactions used to calculated the Weighted balance.
The total weighted balance of the investors investments is used to calculated the EAR.
Report Investor Details
Shows the details for one investor.
Shows the investors current reinvestment options.
Provides access to Portal and Investor Payment reports.
Summaries are included for:
- Investments.
- Transactions.
- Investment payments that are uncleared .
Report Investor EAR Detail
Shows for an investor the calculation used to derive the EAR value.
All investments included in the calculation are shown with the calculated Weighted balance.
The weighted balance can be drilled through to see how the value has been calculated.
Report Threat Metrix
Shows the data collected from each device that connected to the site.
Data shown includes the country and city, and the operating system of the device.
The devices are grouped by the risk rating.
PORTAL |
Investor Account Summary
Self service report for investors to get a Summary of their investments.
Investor Escrow Breakdown
Self service report for investors to check the escrow values raised by the system for payments paid for each investment.
Investor Investment Extract
Self service report for investors to extract detailed data for their investments.
Investor Payment Breakdown
Self service report for investors to view the details of which escrow transactions have been included in a payment.
Investor Payment Reconciliation
Self service report for investors to validate all escrow has been correctly paid.
Investor Payment Summary
Self service report for investors to see what dates payments have been paid.
This report is designed to be used to identify payment dates to be selected when using the Investor Payment Breakdown report.
Investor Portfolio Detail
Self service report for investors to extract a full list of their investments.
Investor Transaction Summary
Self service report for investors to get a breakdown of their transactions for the date range.
APPLICATION |
DW Widget Investment
Dashboard report showing metrics relating to investments.
Used internally by the Portal for the investor dashboard.
Fund Account Statement
Statement of transactions for a fund account of an investor. Showing debit and credit transactions and the balance of the account.
Investment Account Statement
Statement of transactions for an investment. Showing debit and credit transactions and the balance of the account.
Personal Loan Account Statement Report
Statement of transactions for a finance agreement. Showing debit and credit transactions and the balance of the account.
Report - Allocated But Not Posted Statements Report
All bank transactions that been imported from the bank that have been allocated to accounts within Clearmatch but not yet posted.
Report - Credit Decisioning Report
Summary information about an Application, used to help with the credit decision.
Report - Unallocated Statements Report
All bank transactions that been imported from the bank that have not been allocated to accounts within Clearmatch.
REAL TIME |
Report Daily Activity
Shows the listing and application statuses created for the current day.

Related Articles
Overview of the Clearmatch members portal
The Clearmatch members portal is a website that is available for the following participants to access in order to view and manage their details: Borrowers can sign in to: Update their personal details Set personal notification settings for emails and ...